IBM has just announced the general availability of IBM SPSS Statistics 28.0.1. This modification release introduces new statistical tests, enhancements to existing procedures and functional enhancements that will improve everyday usability. In this blog post we outline some of the new features and functionality.
New statistical procedures and algorithm enhancements
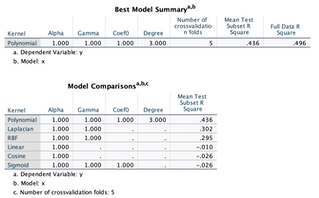
Kernel Ridge Regression
As part of the 28.0.1 release, SPSS has introduced Kernel Ridge Regression, a flexible extension procedure for describing very complex data trends. This Python-based procedure fits kernel ridge regression models with specified model hyperparameters, or selects hyperparameter values over specified grids of values via cross-validation. KRR is an open source extension to the product.

Power Analysis
The power analysis procedure has been enhanced with the introduction of two critical features:
- Precision coverage
- Effect size as input
Power analysis plays a pivotal role in a study plan, design, and conduction. The calculation of power is usually before any sample data have been collected, except possibly from a small pilot study. The precise estimation of the power may tell investigators how likely it is that a statistically significant difference will be detected based on a finite sample size under a true alternative hypothesis.
The new precision feature computes the sample sizes that are required to estimate the population parameter with precision that is determined by user-specified confidence interval half-widths. The expected result produces the minimum sample size to ensure that the actual confidence interval half-widths do not exceed the desired values.
Effect size as an input to the estimation of the power or sample size is now supported. The defined effect size value is passed to the intermediate step in the procedure and calculates the desired power or sample size. The following Power Analysis procedures support effect size as an input to the estimation of the power or sample:
- Power Analysis of One-Sample t Test
- Power Analysis of Paired-Samples t Test
- Power Analysis of Independent-Samples t Test
- Power Analysis of One-Way ANOVA
- Power Analysis of Univariate Linear Regression Test
MIXED Procedure
- The MIXED procedure fits a variety of mixed linear models. The mixed linear model expands the general linear model used in the GLM procedure in that the data are permitted to exhibit correlation and non-constant variability. The mixed linear model, therefore, provides the flexibility of modeling not only the means of the data but also their variances and covariances. The MIXED procedure for linear mixed models now produces Nakagawa’s marginal and conditional pseudo-R Square coefficients of determination for appropriate models. A new output table for the procedure provides the marginal and conditional pseudo-R^2 measures. The table displays only in instances where appropriate.
Data Visualizations
Pivot Table
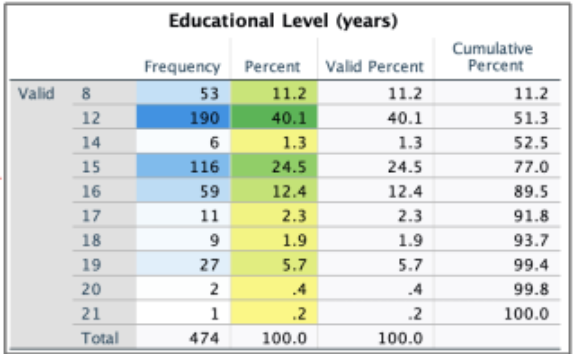
- One of the most widely leveraged features of SPSS Statistics is its pivot table experience, which presents results in tables that can be pivoted interactively. Users can easily rearrange the rows, columns, and layers. Most tables contain a mix of values, and applying a heat map to an entire table typically produces tables with wildly varying ranges. The pivot table editor has been augmented with the inclusion of the menu option Color Scales, which provides heat map style settings that display selected table cells in varying colors based on the cell values.

Usability Enhancements
Opensource integration enhancements
- Workbook Enhancements
- General Usability Improvements
Workbook mode bridges the SPSS Statistics syntax editing ability with an open source, notebook approach that provides an interactive method for running syntax and viewing the corresponding output. As part of this release, SPSS is continuing to evolve the workbook open source experience with a series of enhancements around context menus and syntax paragraphs. The right-click context menu now provides options for cutting, copying, and pasting content, and for displaying the Style Output dialog, which specifies changes to make to selected output objects in the Workbook. To respond to the needs of open source users, syntax-related error information now displays under the syntax paragraph.
Manage license enhancement
The Manage License menu option now shows the license expiration or subscription renewal date with an option to display detailed license information on the output viewer.
Output enhancement: The OUTPUT CREATE command provides options for creating custom tables, charts, and other output items by using data that is included in the syntax.
Additional product information
Visit our product pages to learn more about SPSS Statistics, pricing and purchasing options


