IBM have released the latest version of SPSS Statistics. Version 30 includes new statistical procedures as well as a few additional functional improvements.
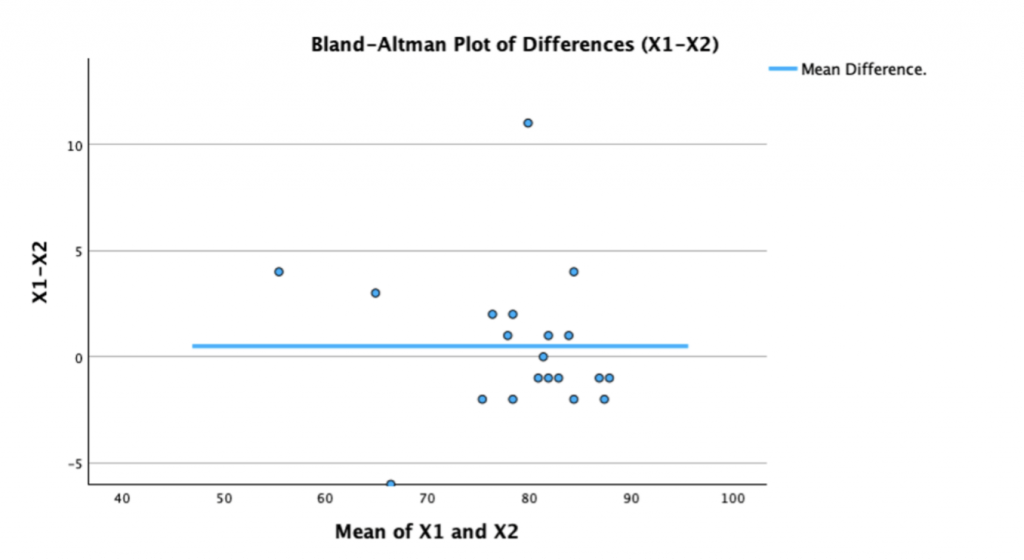
Bland-Altman Analysis
Bland-Altman analysis is a method used to compare two different measurement techniques or instruments. In particular it helps researchers to assess the level of agreement between them by visualizing the differences in their measurements. If, for example, you wished to compare the accuracy of two devices that measured blood pressure, you would take readings from both devices for the same set of subjects. Then, for each pair of values, calculate the mean of the two measurements and the differences between them. We can then visualise the level of agreement between the two instruments by creating a scatterplot, with the mean scores displayed on the horizontal (x) axis and the differences shown on the vertical (y) axis

Normality Analysis
Most of the new statistical functionality is centred around a battery of procedures designed to assess and test for normality. These tests are available in SPSS v30 as a built-in extension based on the MVN R package (v5.9). Multivariate Normality Tests The first set of tests focus on the degree to which variables match the various distributional properties associated with multivariate normality.
- Mardia test – A robust test which assesses whether the skewness and kurtosis of the data match the skewness and kurtosis expected in a multivariate normal distribution.
- Royston test –A test of normality that has been found to behave well when the sample size is small, and the variables are relatively uncorrelated.
- Henze-Zirkler test –A test designed to have good power against various departures from multivariate normality, making it versatile for detecting different types of non-normality.
- Doornik-Hansen test –A comprehensive approach to assessing multivariate normality, considering both univariate and multivariate aspects. Its robust methodology ensures a thorough examination of data distributions.
- Energy test – A robust, non-parametric alternative that is particularly useful when dealing with high-dimensional datasets or when parametric assumptions are not met.
Multivariate Plots: Enhancements There are also a couple of enhancements as to how researchers can assess multivariate normality visually.
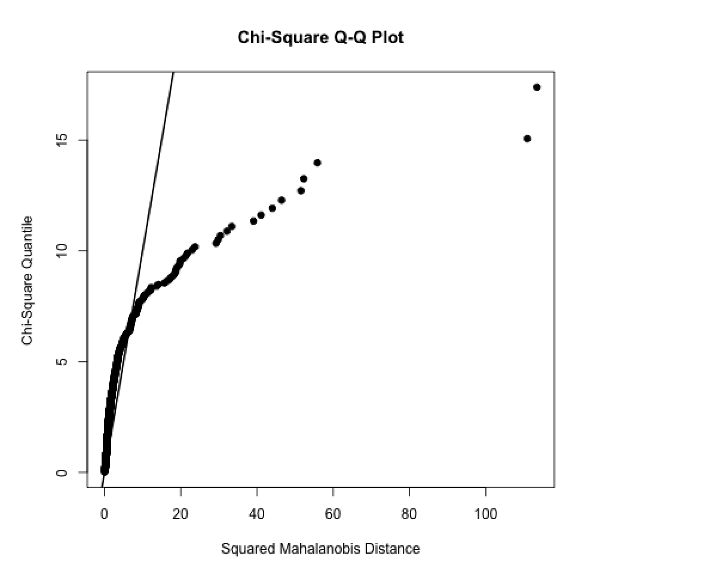
- Chi Square QQ plot – The Chi square Q-Q Plot shows the relationship between data-based values which should be distributed as Chi square and their corresponding quantiles from the Chi Square distribution.

- Perspective Plot – A three-dimensional plot that illustrates where the data are concentrated and how two variables are correlated with each other.
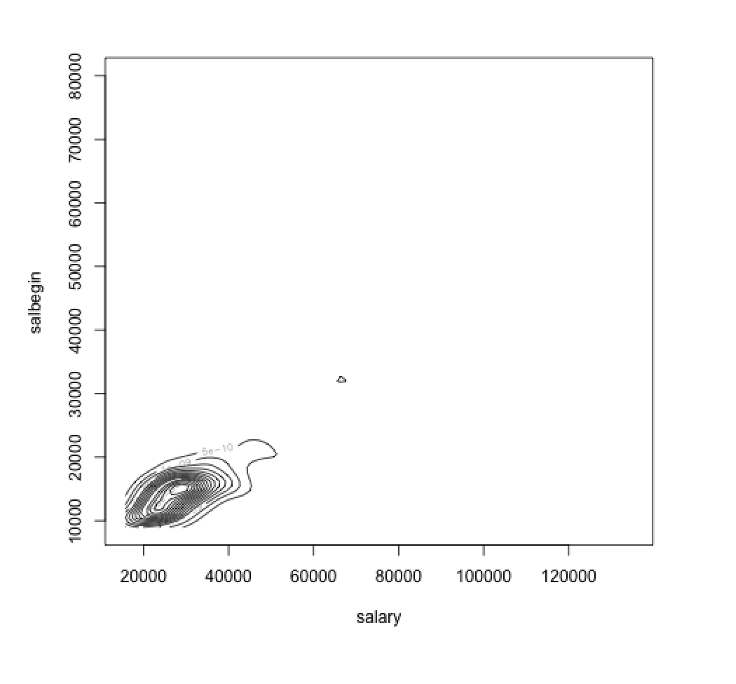
- Contour Plot – A 2-dimensional rendering of the Perspective Plot which can be used for checking the multivariate normality assumption.

Univariate Normality Tests
- Anderson-Darling test – A test used to assess whether variables follow a normal distribution or not. This test is based on the differences between the observed cumulative distribution function and the expected cumulative distribution function under the null hypothesis.
- Shapiro–Wilks test – This tests the null hypothesis that a set of samples came from a normally distributed population or not.
- Shapiro–Francia test – A simplified version of the Shapiro-Wilks test, but one which can be more statistically powerful when working with large sample sizes or specific alternative hypotheses.
- Lilliefors (Kolmogorov-Smirnov) test – Regarded as an improvement on the Kolmogorov-Smirnov test as it corrects for small values at the tails of probability distributions. It is commonly used when the population mean and standard deviation are not known and are instead are estimated from the sample data.
- Cramér-von Mises test – This test evaluates the null hypothesis that a sample comes from a specified distribution, such as the normal distribution.
General Functional Enhancements
- Trial license expiry – In the Launch Screen, Status Bar, and Manage License Screen, users can see how many days are left until trial period expires.
- Dark mode – The application’s background can be switched to a dark colour which reduces light emitted by device screens thus minimizing glare and making it more comfortable for prolonged use
- Font enhancements – Users will be able to make use of text scaling to zoom the fonts throughout the application, not just for charts. This applies to menus, dialog boxes and everywhere those fonts are used.
- Improve Start-up Performance – Users should notice a quicker start-up time when opening the application.
- R Language Runtime Upgrade – The system now makes use of R version 4.4 (previously 4.2.2).


