In most businesses it’s not enough to simply be measuring outcomes like customer satisfaction, sales, customer churn rates, subscription renewals, customer loyalty, cancellation rates and so on. To gain competitive advantage you also need to know what’s driving those outcomes. Which aspects of the service you provide most influence how likely someone is to renew their subscription at the end of the year? Which factors most drive recommendations? Key driver analysis (KDA) can help you to answer these kinds of questions.
KDA enables you to look for relationships between aspects of customers’ attitudes, needs and behaviours that you’re interested in, and variables that might be driving those customer dimensions. Commonly, analysts use survey data as part of a KDA to figure out what is driving outcomes like customer satisfaction and customer loyalty, often using Net Promoter Scores (NPS), but you can use data from any source that you have available and which gives you access to variables such as customer demographics and behaviours. And these additional sources can help you understand the same drivers and more. We can extend the traditional KDA to look at behavioural outcomes like sales and retention.
KDA looks for correlations between variables. For example, perhaps there’s a positive correlation between how satisfied customers are with the service they get when they visit a branch and how likely they are to recommend your company to others, in which case you could say that satisfaction with the branch service is one of the factors that is positively driving recommendations. KDA can also identify factors that are associated with driving customer behaviour negatively, things that make them less likely to recommend you to others.
So, here are 7 useful things to know before you start applying key driver analysis to your own data.
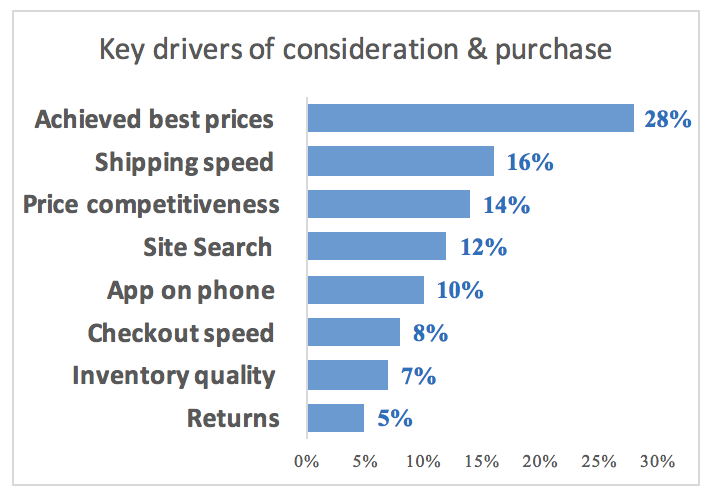
- KDA helps you prioritise your changes/improvements. Key driver analysis not only tells you which variables (the independent variables) are driving your outcome of interest (the dependent variable) – it can also tell you the relative importance of several different variables and identify which has the highest influence on how likely a customer is to recommend you. This Importance score is expressed as a %. If we are using Linear Regression for the KDA (and this is the most widely used method) we use the standardised coefficients generated but the regression. These are commonly known as the beta weights.

- The beta weights tell you the importance of each driver variable. The beta weights represent the amount that each “dependent” variable (the target of the KDA) changes, as measured in standard deviations, when the “independent” (driver/predictor) variables change. For example, if store satisfaction has a beta weight of .68 compared to a beta weight of .15 for satisfaction with price, that means that a one standard deviation change in store satisfaction scores will increase the likelihood to recommend scores by .68 standard deviations, whereas a one standard deviation change in price satisfaction will result in an increase in likelihood to recommend scores of only .15 standard deviations, suggesting that satisfaction with the store experience is a more important driver of recommendations than is satisfaction with price.
- Key driver analysis is most often based on MLR (multivariate linear regression). Most often this means OLS (ordinary least squares) regression. MLR identifies the combination of independent variables that best drive/predict the dependent variable of interest. It generates an R-squared value which is a measure of how well the model predicts the dependent variable. For example, an R-squared value of .75 would tell you that the independent variables in your model explain 75% of the variance in the dependent variable. There are a number of alternative/competing methods, including a more straightforward correlation analysis, that can also be used. We’ll elaborate on the pros and cons of these in a later blog.
- KDA can work with both categorical and continuous variables as candidate drivers. That said, we do need to distinguish the different types and choose the right method. And we need to watch out for too much inter-correlation (statisticians will rightly warn about the danger of “multicollinearity”).
- We need to keep an eye on driver variables that are highly correlated with each other. In the worst case this can create what is referred to as multicollinearity, which can break the regression altogether (beta values >1 are a common symptom of multicollinearity). More typically, however, multicollinearity can distort the results of the KDA. Let’s say for example that satisfaction with reception and satisfaction with the booking process are highly correlated with each other and they both correlate about the same with overall satisfaction with our hotel. A standard MLR may give all the driver importance to reception and give much less satisfaction to the booking process. This is often called the “false alarm” issue. In recent years statisticians have moved to using other forms of regression e.g. Shapley or relative weight to address this issue.
- KDA isn’t “one size fits all”. As we know, customers are never one homogenous group and we usually look at different drivers for different groups to understand the different needs, attitudes and/or behaviours in more detail.
- If the KDA model is good enough we can predict and simulate with it. We can test the accuracy of any KDA model (as we do with any other predictive model). If it passes muster we can then use it as decision making tool to run what-if? scenarios e.g. if we improve satisfaction with our shipping speed by 5% what would the impact be on customer loyalty?
Download our free KDA tool
If you’re interested in exploring key driver analysis more why not download our free key driver analysis extension for SPSS Statistics which lets you generate the requisite KDA visualisations in one analytical step. With this plug in you’ll be able to:
- Execute a regression analysis on the specified drivers and target e.g. customer satisfaction
- Standardise the beta coefficients/weights to derive the importance scores
- Generate a key driver chart
- Generate an importance v performance (quadrant) map


