After basic significance tests, T-tests, Z-tests and so on, key drivers analysis (KDA) is probably the second most popular statistically-based technique in market research. Given an outcome of interest a KDA gives us a measure of the relative importance of a set of attributes (potential drivers).Typical outcomes of interest in research are:
- Satisfaction – customer, employee etc.
- Purchase intent – how likely a customer is to make a purchase
- How likely a respondent is to recommend a product or service (sometimes known as a Net Promoter Score)
- Intent to switch or cancel
This isn’t an exhaustive list and outcomes can be stated or observed (through other data sources like transactional databases) where applicable.
Like many things statistical, there is some debate about the best method to use and different techniques have their strengths and weaknesses. We will return to this discussion in a later post, and look at some alternative methods. However the most common stats methods for KDA are correlation and/or regression.
We usually look for the drivers of these outcomes in sets of attributes. So let’s say we’ve asked hotel visitors to rate their overall satisfaction with their last stay on a scale of 1-10 where 10 is Excellent and 1 is Poor. We also ask them to rate various attributes of their stay including:
- Satisfaction with their on-line reservation
- Satisfaction with their telephone reservation
- Room cleanliness
- Satisfaction with housekeeping
- Rating of the check-in experience
- Rating of the check-out experience
- Rating of the breakfast
- Overall rating of the helpfulness
- Overall rating of the politeness of the hotel staff
- Rating of hotel facilities
Let’s say that these attributes are measured on the same (1-10) scale.
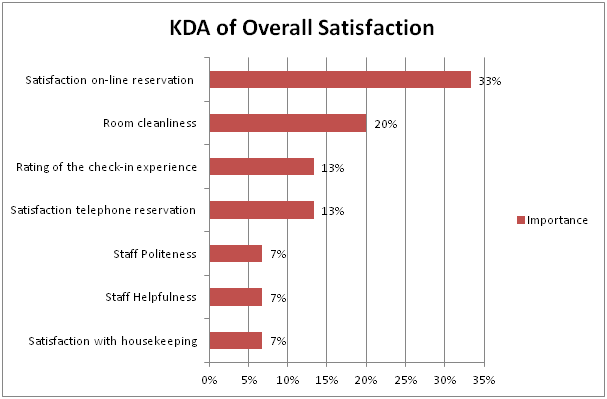
To perform the KDA in this instance we run a stepwise regression analysis where overall satisfaction is the dependent (outcome) and our 10 attributes are the independents (drivers). The stepwise regression figures out which are the strongest drivers and only includes them if they are statistically significant. Here we end up with 7 out of the original 10.
In our example we see that the strongest driver of overall satisfaction is how satisfied (or otherwise) a respondent was when making an online reservation.
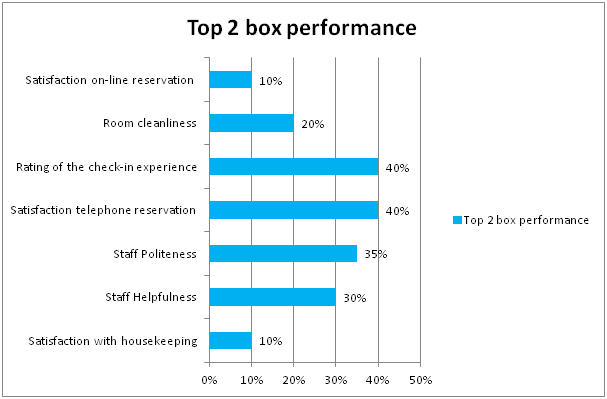
If we look at the top-2 box – % of respondents rating each of these attributes 9 or 10 – we see that our strongest driver is performing relatively poorly as it is only scoring 10%. So there is something about the on-line reservation process which means it is performing badly and is clearly impacting overall satisfaction. Hopefully we have more evidence in the research to understand what it is about that process that needs fixing!
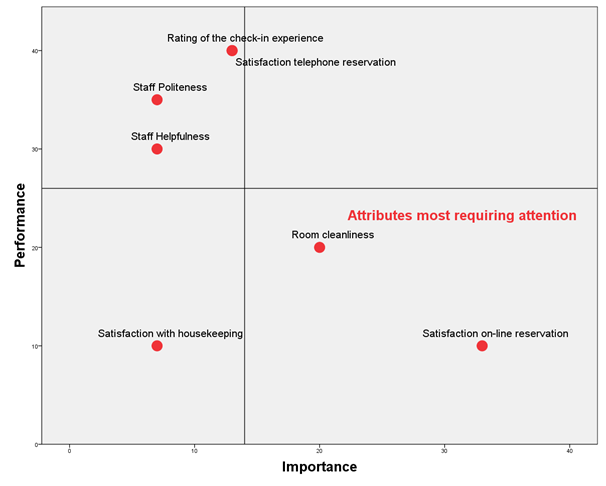
We can combine both of these views in a single quadrant plot which emphasises the two main challenges the hotel company faces where Importance is higher and Performance is lower.
This illustrates one of the potential strengths of KDA. If we are able to design the questionnaire to include attributes which are actionable within the business the technique can focus our attention on the areas we need to improve on, or alternatively those things that we need to keep doing well.
Often our first cut at a key drivers analysis leads us to ask more questions like:
- Are there groups (segments/classes) of customers who have different views of importance?
- If we improve our score on an important driver what will be the impact on the outcome?
- What are the relationships between the drivers?
You can download our free Key Driver Analysis SPSS plug in here.


